
Supply and Demand Zones Tips
- Ken

- Oct 24, 2021
- 4 min read
Disclaimer: I'm using a lot of examples from E-mini S&P Futures & the Nasdaq futures as they are consistently traded throughout the day with volume and data as compared to the S&P, QQQ or other large-caps tickers.
If you haven't read my previous article on how to draw demand & supply zones, I suggest you read it first to learn the different types of zones and how to chart them:
Determining Strength of Zone
Zones that form after a strong rally or a strong drop are the ones that form the strongest zone.
Why? For Demand zones to be strong & effective, the initial downtrend move has to be sharp and indicates a lot of selling pressure. The big institutions have to place a huge amount of orders to absorb all the selling pressure that is formed during a strong downtrend. This creates excess demand which then results in price reversing and rallying. However, we know these big institutions obviously can't get all their orders entered, so what they do is allow the price to come back down again in the near future into the initial demand zone to collect their orders before rallying to the upside.
Let's take a look at the E-mini S&P Futures on the 4hr timeframe, we can see during the recent correction there is strong downward selling pressure. And then the price forming demand before rallying to the upside.

Narrowing down to the 1hr timeframe, we see price tapping the zone quickly with lower WICKS which indicates buyers stepping in, and forming higher lows base on the trendline.
This shows the institutions coming in to pick up their remaining buy orders before the price rallying upwards.

Let's revisit another example on a smaller timeframe. 10m Demand Form after a sharp drop in price on the ES mini.

Then on a smaller 5min timeframe, the price revisits the zone again, pick up remaining buy orders before rallying up.

Same thing for Supply Zones: On $FB 1hr Timeframe, formed a 1hr Supply Zone, a strong uptrend on the initial move, before basing out and dropping. Institutions placed their sell orders there, allowing the price to come back up, collecting their sell orders in that zone. And then a huge drop after that.
Again, as noted earlier, the upper wicks indicate sellers stepping in and pushing the price down. So very important to look out for wicks to form in demand & supply zones.

$AAPL on 4hr Timeframe:

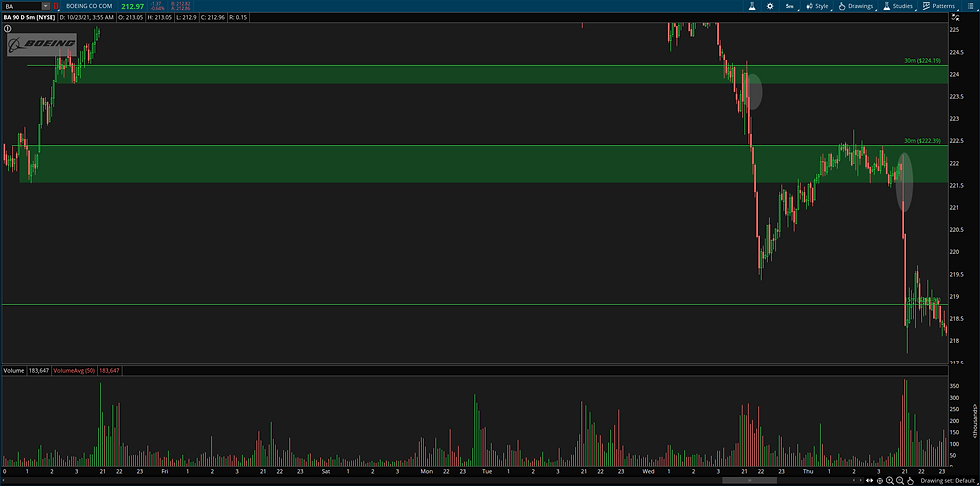
$NVDA 30m Timeframe:
Strong Rally up, form 30m supply. Supply absorption twice before price declining.

TRY Avoiding RBR and DBD Zones:
RBR and DBD zones are continuation movement that is formed in the middle of an uptrend or downtrend. It is important to note that you shouldn't trade RBR or DBD zones but rather try avoiding it unless there are indications that buyers or sellers are stepping in when in the zone.
However, If the price has already been on a downtrend or uptrend for a considerable period of time, it is best to avoid trading these 2 types of zones that are formed. This is like basically trading in no man's land and more often than not, they get breached.
Another pointer is also to see on a larger timeframe if the price has already reversed. If they do, then DBD zones would be less effective as the institutions have already picked up their buy orders earlier, so why would they let it drop after in a short period of time? It doesn't make sense at all for them.

DBD getting Breached after Sharp Downtrend:


RBR getting breached:


If you want to trade these zones, entries must be on the first touch and profits have to be taken quickly. I would much rather trade on anticipation of RBR or DBD. You must be able to predict that it is going to form these 2 zones by looking out for basing candles and then entering once it breaches the high or the low of that candle.
This is by no means that you should eliminate RBR and DBD zones from your trading, they do work, but you need to be able to note what the current trend is.
i) DBD: Have we reversed the downtrend on a larger timeframe?
ii) RBR: Are we still in the middle of a downtrend?
Entering Flip Demand or Supply Zones on the 1st Touch:
You should only enter flip zones if they display wicks such as the examples given below. Again, they are not high probability setups which you can also see from below why i said this.
Successful Flip Zone:

Unsuccessful or Choppy Flip Zones:


Zones inside of Zones
I find this particularly effective in trading these types of zones. This shows the strength of the previous zone which then form another demand zone by institutions when they stepped in with buying pressure and then stepping in again when it revisits the zone
Always look for zones to form in previous zones and then enter your trade when price revisits that inside the formed zone.


Using Patterns:
Utilize reversal patterns for conviction in your supply or demand zones. There are literally so many different chart patterns to use, look for the reversal once like falling wedge, rising wedge, h&s, inverse h&s, double top, double bottom, ascending & descending channel.
Look for these patterns to form inside of your supply & demand zones to spot reversals.
Volume:
When price approaches the zone, look for heavy selling into the zone. Heavy selling means there is heavy ABSORPTION of that selling. There must always be a buyer from a seller. And then also sometimes you will see a low volume test of the zone before rallying up

Below are also some notes that I have curated myself for S/D Zones from: https://dotnettutorials.net/lesson/how-to-trade-with-supply-and-demand-zone/


Comments